Published
Determinants of 5G Deployment: How Scale, Regulations, and Market Structure (but Not Restrictions) Matter
By: Badri Narayanan Gopalakrishnan Hosuk Lee-Makiyama
Research Areas: Data, AI, and Emerging Technologies

What factors determine the adoption and investments into new digital technologies?
In the past, the concept of a digital divide assumed that there was a performance gap between wealthier (often Western) economies and developing countries. However, as China, India, and the Middle East have rapidly moved to a full 5G SA (“stand-alone”), while the much wealthier Europe is struggling to deploy entry-level 5G and has yet to launch a single commercial 5G SA network.
The sub-optimisation in Europe, and elsewhere, is often attributed to a variety of factors. Market fragmentation (with too many operators), delayed or costly spectrum auctions, equipment vendor exclusions, or insufficient demand are typically cited as the reasons. Yet, these hypotheses are untested and serve as mere Rorschach tests, revealing the bias behind the assertions.
The determinants of national 5G deployment should be the result of an intricate interplay of demographic, macroeconomic, and market factors (such as population size), which are fixed and a “fact of life,” since regulators cannot change the national income or the size and shape of its territory in the short term. In contrast, regulatory decisions have varied significantly among different countries, making a cross-country dataset particularly useful for understanding this interplay of factors, ceteris paribus.
Little or no existing literature
While there is consensus that both economic structures and policies determine the pace and cost of the 5G rollout, there is no quantitative or econometric evidence to date. Most cross-country analyses confirm or assume that GDP and operator revenues drive network investments, while high spectrum fees, market concentration, and late licensing constrain deployment (Bauer and Bohlin, 2020; GSMA Intelligence, 2023).
The existing literature on vendor exclusion assumes or identifies measurable transitional effects but primarily relies on descriptive information rather than econometric methods. Moreover, political science frames these effects as trade-offs in which national security takes precedence over pure cost efficiency (Segal, 2022). In terms of quantifying these costs, business literature (Strand Consult, 2020) uses a bottom-up engineering-cost calculation to assume a 10–30 per cent increase in capital expenditure and 6-to-24-month rollout delays, not least due to litigations that delay the auction process. Meanwhile, the European Commission’s 5G Observatory (2023) applies a top-down sensitivity model, combining operator and regulatory data to project smaller, short-term cost increases and temporary delays before markets adapt.
However, neither study is a product of statistical inference that employs regression and causal identification. In other words, the academic and business literature is rich in political economy and descriptive data, but relatively poor on causal evidence across multiple countries in different regions and income groups: There is no global econometric study that quantifies the relative weight of income, geography, market structure and policy choices that may have shaped the outcome – a gap this piece aims to address.
Methodology
This study is likely the first of its kind to examine heterogeneity and national 5G performance scientifically. It relies on the robust benchmarks compiled by the GSMA, the global industry association of telecom operators, in late 2024: Its 5G Connectivity Index includes composite and sub-indices for 39 countries that had launched commercial 5G networks (up to Q3 2024), based on actual data observed and reported by telecom operators themselves. This makes the data highly suitable for describing national performance in detail.
As an initial research approach, we utilise the composite Connectivity Index, along with two sub-indices network coverage and affordability – that collectively measure key deployment outcomes. Methodologically, the Tobit framework is used, given the bounded nature of these variables, which range from 0 to 100. The dataset also integrates explanatory variables:
- General demographic and macroeconomic variables: GDP per capita, urbanisation rate, population size and median age – to capture economic development, economies of scale, population concentration and profile.
- Variables that describe the state of the telecom market – Herfindahl-Hirschman index (HHI), ARPU, and presence of certain multinational operators – that cover market concentration among operators, profitability per user, and internationalisation of telcos.
- Regulatory variables that describe national regulatory frameworks – i.e., earliness of the spectrum allocations (actual time available for deployment), whether spectrum was auctioned or licensed, spectrum licensing costs, availability of public financial incentives, and whether licences for private networks for industrial use have been granted (that might erode operator revenues).
A subset of regulatory policies concerns exclusions of network equipment vendors. Such exclusions may be:
- Comprehensive bans (de facto or de jure) of at least one vendor across the 5G value-chain, or partial restrictions for specific domains (e.g., core networks or “management” systems), geographic areas, or quantitative limitations based on market shares (which includes China’s quantitative ceiling for EU vendors), or limitations for certain operators.
- These restrictions may have been enacted many months or years after rollout, resulting in replacement costs. On rare occasions (e.g., Australia), the restrictions were also announced before any spectrum allocations were made.
- The financial impact of these restrictions may be softened by phase-out periods granted, with actual enforcement deadlines up to eight years in some cases.
Results #1: Overall 5G Connectivity Index
Looking at the Tobit regression model with the principal and composite GSMA 5G Connectivity Index as the dependent variable yields the following coefficients, using all observations in the dataset.
Table 1: Tobit regression coefficients for GSMA 5G Connectivity Index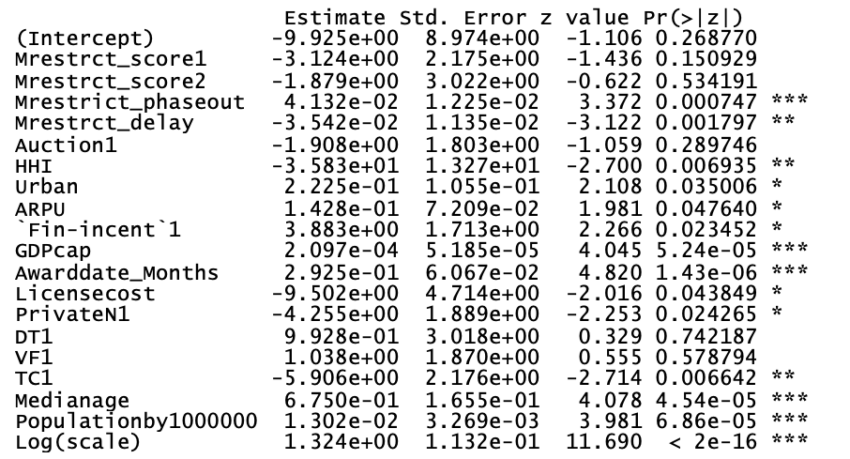 Interestingly, nearly all variables return highly significant results, often at 0.001% or 0.01%-levels. The exceptions are, first, whether the spectrums were sold off to the highest bidders (Auction1), as in the case of the majority of the countries or issued through regulatory decisions.
Second, it is impossible to determine any impact from vendor restrictions, whether they were complete bans (Mrestrct_1), partial restrictions (Mrestrct_2), or unrestricted (both variables). However, the 5G Connectivity Index is somewhat affected by the timing of the vendor restrictions when those decisions were taken: For each month delayed in the decision, the overall score decreases by 0.035 points, while each month allowed for phase-out increases the score by 0.041 points. In other words, the restrictions themselves did not affect 5G connectivity, but how these decisions were taken did impact the rollout. An early restriction decision (Mrestrict_delay), in some cases even ahead of the spectrum auctions for legal certainty, or a generous phase-out period (Mrestrict_phaseout), improved the connectivity score by up to four points each.
As the coefficients are based on different units and variations, it may be difficult to discern the relative importance of each coefficient. The following range-based sensitivity, from the highest to the lowest observation for each variable, leads to the subsequent impact range on the 5G Connectivity Index, which better illustrates their relative importance.
Table 2: Variable range among significant variables and impact on the index 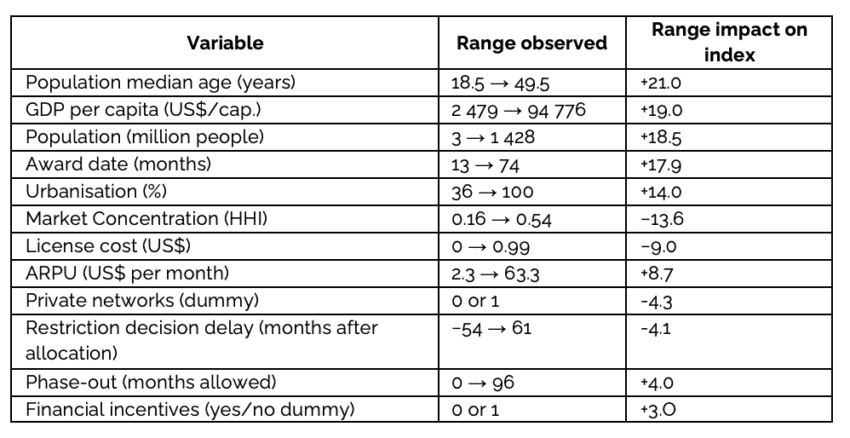 NB: Other coefficients were not significant and cannot be proven to have an impact.
Unsurprisingly, there is a strong correlation with high-income levels, large populations, or high spatial density. In this context, median age is likely to be another channel for economic maturity rather than a reflection of the population’s physical age, furthering the impact of national income levels.
It may also seem obvious that the earliness of the national spectrum allocation (the number of months since licenses were issued) is the most important variable among those over which a national regulator or the industry exerts some level of control. Naturally, countries that allocated their spectrums early had more time available to deploy, leading to better scores. Other variables that had a significantly negative impact were overly high market concentration, high spectrum licensing costs, and overall lower revenue opportunities (ARPU).
As a minor note, the impact of certain multinational operators is likely to result from their investment strategies (some of which focus on later-stage developing countries) rather than from their market presence.
Results #2: 5G Coverage
The 5G Connectivity Index includes a specific sub-index, which measures the proportion of the population covered by 5G connectivity. Looking specifically at coverage as the dependent variable instead yields the following coefficients, once again with all observations in the dataset. 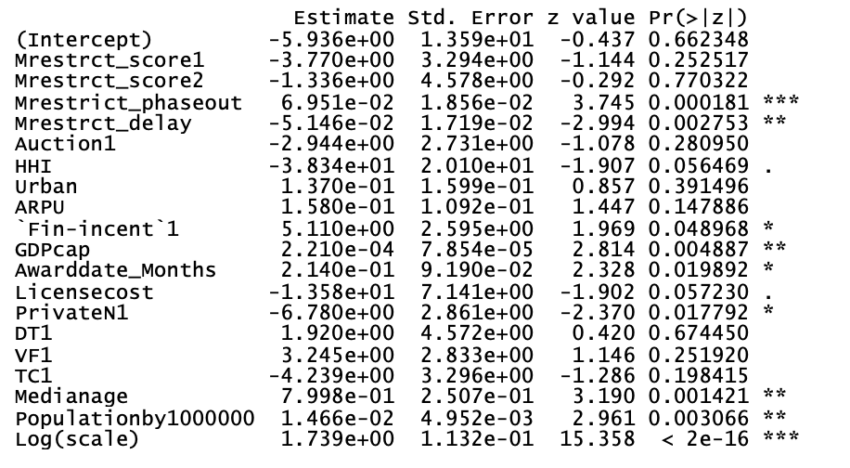 Highly urbanised countries, like Singapore, the UAE or Korea, are in the top tiers of the connectivity ranking. However, somewhat surprisingly, coefficients for the urbanisation rate and ARPU are not statistically significant for infrastructure coverage, unlike those for the composite 5G Connectivity Index.
The results are otherwise similar to those of the previous model for the overall index, as vendor restrictions, whether spectrum was auctioned or licensed, or the presence of multinational operators continue to have no significant impact. However, financial subsidies, private network licences, restriction delays and phase-out periods are slightly augmented at the expense of the earliness of launch and macro-demographic variables.
Results #3: Affordability of 5G Service
The second sub-index describes the affordability of 5G services for users and consumers. This sub-index, in turn, combines two dimensions that measure the actual price of 5G devices and mobile services, respectively, as a percentage of the average monthly income. In this regression, we only look at the cost of services, as we have no interest in the price of phones and devices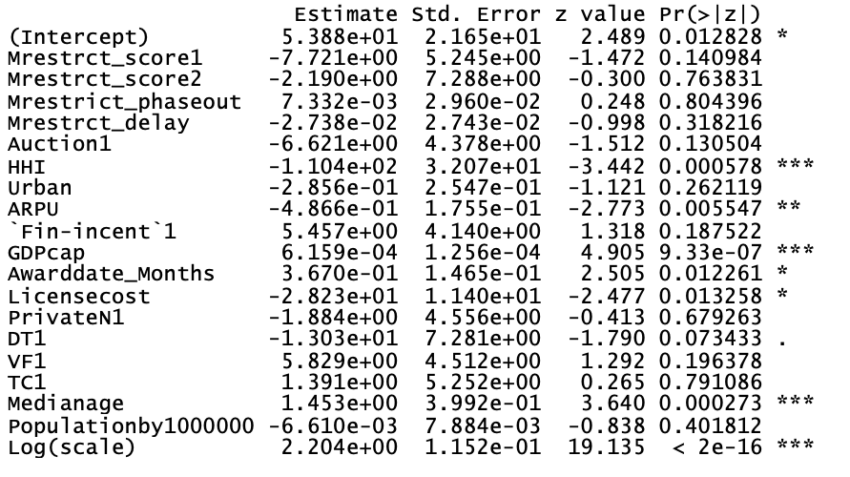 Regarding 5G affordability, none of the coefficients for population size, urbanisation, financial incentives, private networks, or the vendor restriction variables are significant. Naturally, ARPU also shifts direction from slightly positive to strongly negative. Higher revenue should typically entail lower affordability for users, unless market demand for value-added services drives revenue. In addition, licensing costs and operator market concentration have a much stronger negative influence (approximately three times) than in the first experiment on the composite index.
Some concluding thoughts
In the midst of an era defined by technological rivalry, securitisation and industrial competitiveness, these early results are the first real attempts to approach a contentious, politicised and opinionated subject in a statistically sound and dispassionate manner.
While this model uses a cross-country dataset, it goes without saying that further research is needed to better understand the firm-level investment behaviour of operators and the effectiveness of public subsidies, given that the quality of some peripheral variables (especially financial subsidies) cannot be determined.
Nonetheless, these preliminary results allow for some interesting conclusions on why certain countries succeed in deploying 5G networks. Notably:
- The natural benefits offered by an advantageous geography, a wealthy and capital-intensive economy, or large populations – i.e. economies of scale – mattered much more than what has been discussed.
- Among the factors that the national regulators may influence, early licensing of spectrum mattered most for overall 5G connectivity. However, it is unclear whether this first-mover advantage is sustainable or will be saturated once other countries catch up over time.
- A sound market structure – i.e., a reasonable market concentration and healthy ARPU – matters as much as early deployment. Keeping all other factors constant, a high ARPU remains positive for overall 5G connectivity, although it may be negative in terms of affordability.
- Given that network infrastructure represents a relatively small cost for operators, it is unsurprising that neither full vendor exclusions nor partial restrictions in themselves affect 5G connectivity, coverage, or service affordability. Rather, it is a matter of how (e.g., permissive phase-out periods) or when (i.e., early decisions for legal certainty for operators) these restrictions are implemented once they are imposed.