Published
Europe’s Innovation Gap: Five Charts and Five Takeaways for an Evidence-Based Debate
By: Andrea Dugo
Research Areas: EU Single Market, Institutions, and Governance Industrial and Competitiveness Policy Innovation, IP, and Human Capital

Rivers of ink have been spilled in recent years on Europe’s stagnating innovation performance and declining competitiveness. The Draghi report is the most prominent among many studies examining the causes and consequences of this gap. At ECIPE, we have also devoted sustained attention to issues of productivity and economic growth – primarily in comparison with the US, but also with other advanced economies such as South Korea and Switzerland. In this context, we have also repeatedly highlighted Europe’s lag in technological development and innovation investment.
The widening innovation gap between Europe and other frontier economies is a serious concern that fully warrants continued, detailed analysis. Yet despite the volume of research produced, gross simplifications – and in some cases outright misconceptions – continue to shape public and policymaking debates on Europe’s competitiveness.
Ahead of the informal retreat of European leaders on 12 February, which will relaunch discussions on competitiveness and where Mario Draghi will also be present, this Insight seeks to bring greater clarity to an increasingly crowded debate. Rather than adding another lengthy report, it aims to establish five key takeaways through five concise charts.
This analysis focuses on innovation through the lens of business research and development (R&D) expenditure. While R&D is not synonymous with innovation – innovation is a broader process, and not all successful firms are among the largest R&D spenders – it remains the most widely accepted indicator of technological capability and innovative capacity. It is also the area in which Europe’s underinvestment is most pronounced, and where corrective action is most urgently needed.
All five charts draw on data from the EU Industrial R&D Investment Scoreboard, which covers the world’s top 2,000 corporate R&D investors and accounts for over 90 per cent of global business R&D spending. The breadth, consistency, and longevity of the dataset – most recently updated in December 2025 – allow for a long-run perspective spanning two decades. This makes it possible to identify structural patterns rather than short-term fluctuations, anchoring the analysis firmly in empirical evidence.
Watching Others Pull Ahead: Europe’s Innovation Decline
Figure 1: Evolution of global corporate R&D shares by region, 2003–2024 (percentage)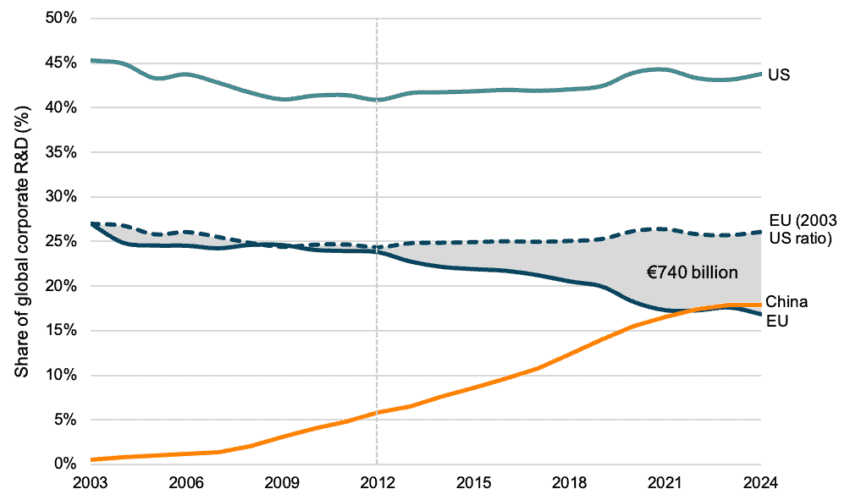 Source: Author’s calculations based on EU Industrial R&D Investment Scoreboard.
Figure 1 is the first of the five core charts and sets the tone for the overall message on Europe’s innovation gap. It shows the evolution of corporate R&D spending by EU, US, and Chinese firms as a share of total global business R&D between 2003 and 2024.
The chart traces Europe’s innovation trajectory in direct comparison with the two other major global economies. Throughout the 2000s, and up to the early 2010s, Europe’s position remained relatively stable. Although its share was consistently below that of the US, it declined only marginally over this period, even as China’s role expanded rapidly. The dotted line indicates the path the EU would have followed had the ratio between its share and that of the US remained at its 2003 level. Until around 2012, this counterfactual trajectory closely mirrors the EU’s actual performance.
The turning point emerges in the early 2010s. From then on, while the US share remained broadly stable – and even increased slightly – and China’s continued its steady rise, Europe’s share entered a sustained decline. Compared with a scenario in which it had kept pace with the US, the EU accumulated a growing “unrealised R&D investment” gap. By 2024, this cumulative shortfall amounts to approximately EUR 740 billion, of which around EUR 701 billion – 95 per cent – has accrued since 2012. In 2024 alone, the annual gap reached EUR 114 billion.
As a result, the EU now has the smallest share of corporate R&D spending among the three major global economic players. This decline closely mirrors the erosion of Europe’s weight in the global economy more broadly. While early warning signs were already visible, the data clearly identifies the early 2010s as the start of a persistent and structural downturn in Europe’s business innovation position. This marks the first central lesson of the analysis.
The Sectoral Anatomy of Europe’s R&D Gap
Figure 2: EU share of global corporate R&D by sector, 2004 and 2024 (percentage)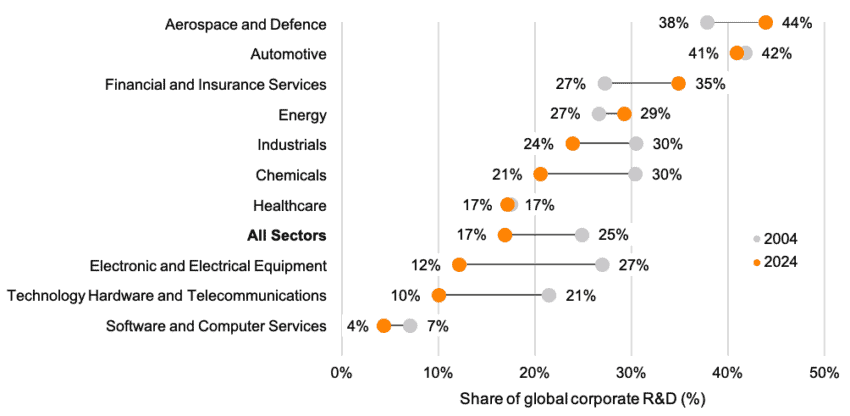 Source: Author’s calculations based on EU Industrial R&D Investment Scoreboard. Note: Selected ICB Level 3 sectors as reported in the Scoreboard have been aggregated for analytical clarity.
Figure 2 disaggregates Europe’s overall decline in corporate R&D into its sectoral components by comparing the EU’s share of global R&D spending across major industries in 2004 and 2024.
The chart shows that Europe’s loss of ground has been broad-based – from an average of around 25 per cent to 17 per cent across all sectors – but is particularly pronounced in technology-intensive industries. The smallest shares are observed in Software and Computer Services, where Europe’s initial position was already weak, as well as in Technology Hardware and Telecommunications and in Electronic and Electrical Equipment, where the EU had previously occupied a more central role. In these sectors – paramount to digitalisation, AI, and advanced manufacturing – the EU’s share of global R&D has more than halved over the past two decades.
Much attention in Europe has focused on the loss of competitiveness in the automotive sector, and not without reason. Yet, in R&D terms, Europe has proved relatively more resilient in traditional capital-intensive industries, including Automotive, Aerospace and Defence, and Energy. This is not to deny the pressures affecting these sectors, but rather to highlight that they are not the primary drivers of the overall decline.
Instead, Europe’s R&D shortfall is concentrated in those sectors that now define the technological frontier: digital services, computing, telecommunications, and advanced electronics. These are industries in which Europe either failed to build global scale in the first place, as in software, or gradually lost ground to international competitors, as in hardware and telecommunications.
The aggregate decline documented in Figure 1 is therefore not the result of uniform weakness. It reflects a structural innovation deficit in precisely those sectors that currently generate the strongest spillovers to productivity and long-term growth. Europe’s R&D gap is thus not only quantitative, but also qualitative: it is increasingly concentrated in platform-based, data-intensive, and high-growth technology domains.
Europe’s innovation decline has a clear birthdate: the early 2010s. And it has equally recognisable parents: the digital and high-tech sectors that now dominate global innovation.
Renewal Without Reordering: Europe’s Innovation Bottleneck
Figures 3 to 5 examine a third dimension of Europe’s innovation gap: not how much firms invest in R&D, nor in which sectors, but how effectively innovative activity is renewed over time.
Figure 3: Number of 2004 Top 50 firms still in the Top 50 by region, 2004–2024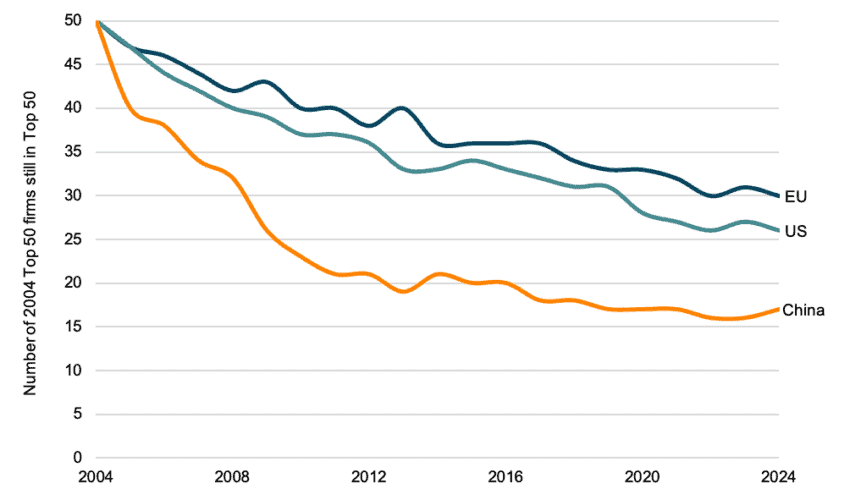 Source: Author’s calculations based on EU Industrial R&D Investment Scoreboard.
Figure 3 tracks how many firms that ranked among the top 50 R&D spenders in 2004 remain in the top 50 over the subsequent two decades, by region.
China displays high turnover: by 2024, only 17 of its original 50 R&D leaders remain in the top tier. This pattern is consistent with a latecomer, catch-up economy, where rapid entry, consolidation, and technological upgrading tend to displace early incumbents.
What is likely more striking to most is the similarity between Europe and America. By 2024, 30 of the EU’s original top performers remain in the top 50, compared with 26 in the US. Not only is the gap modest; it remains remarkably stable over time.
This small difference suggests that neither system is characterised by large-scale corporate extinction nor by structural stagnation. The chart challenges the familiar caricature of a static Europe dominated by entrenched incumbents versus a hyper-dynamic US where relentless churn continuously replaces leading innovators.
Instead, both regions display a mixed pattern of continuity and renewal. A majority of leading firms from the early 2000s remain among the top R&D spenders today, alongside substantial and ongoing firm turnover.
Figure 4: Share of regional R&D by 2004 Top 50 firms, 2004–2024 (percentage)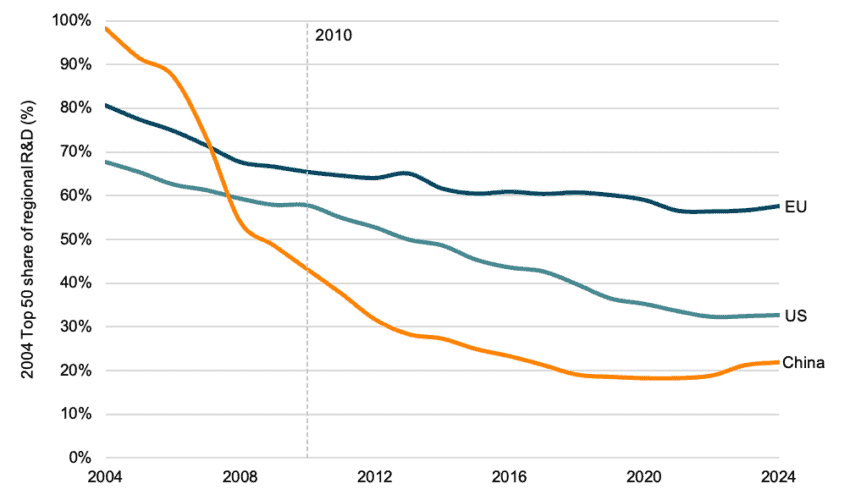 Source: Author’s calculations based on EU Industrial R&D Investment Scoreboard.
Figure 4, however, adds another angle. The chart shows how much of total corporate R&D continues to be carried out by the 50 firms that dominated in 2004, again by region, over the past two decades.
As in Figure 3, China’s R&D share of early leaders collapsed from nearly 100 per cent to around 20 per cent by 2024, reflecting rapid displacement and large-scale expansion by new entrants.
By contrast, this time the US and the EU diverge sharply. In Europe, nearly 60 per cent of corporate R&D spending in 2024 remains concentrated in firms that were already dominant twenty years earlier. In the US, this share has fallen to roughly one third. Crucially, the gap between the two regions began to widen around 2010: what was then an eight-percentage-point difference has since expanded to around 25 points.
This pattern suggests that while many US incumbents have survived, their relative importance within the innovation system has diminished substantially. New firms have captured a growing share of R&D investment, reducing the centrality of established leaders. In Europe, instead, incumbents have not only endured but have largely retained their dominant position, continuing to shape the direction and scale of R&D activity.
Put differently, the US is far from a textbook model of Schumpeterian creative destruction. Many incumbent firms remain at the top of the innovation system. Yet their position within the corporate innovation hierarchy is continually reshuffled. Established companies persist, but they increasingly play supporting rather than leading roles, as new firms move to the innovation frontier. In Europe, incumbents tend to remain both present and dominant, with more limited competitive displacement.
Figure 5: Share of regional R&D by firms founded since 1990, 2003–2024 (percentage)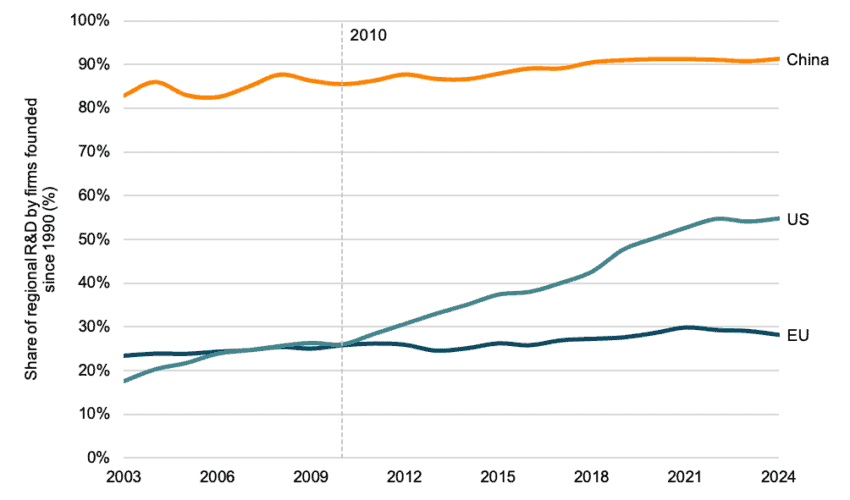 Source: Author’s calculations based on EU Industrial R&D Investment Scoreboard.
Figure 5 reinforces this contrast by focusing on the R&D contribution between 2003 and 2024 of firms founded since 1990, again by region.
Consistent with its latecomer catch-up trajectory, China stands out. Throughout the period, post-1990 firms account for more than 80 per cent of corporate R&D spending, rising to over 90 per cent today. Innovation leadership is thus overwhelmingly concentrated in relatively young companies.
In the US, younger companies now generate more than half of total R&D spending, pointing to a sustained capacity to create and scale new innovation leaders. In Europe, their contribution remains stuck at around 28 per cent. The time dimension is equally revealing. Until the early 2010s, the US and the EU displayed broadly similar patterns. From around 2010 onwards, the share of R&D carried out by younger firms rose sharply in America, while remaining virtually flat in Europe.
The US system has repeatedly elevated younger firms – such as Alphabet, Amazon, Meta, and Nvidia – into positions of innovation leadership. In the EU, very few new firms have managed to grow into globally significant R&D players. As a result, Europe’s corporate R&D system remains dominated by ageing incumbents, even when some of these gradually lose global competitiveness.
Taken together, Figures 3 to 5 point to a central structural difference between the European and American innovation systems. The contrast is not primarily about firm survival, but about hierarchy, leadership, and renewal.
Europe’s challenge is therefore not to wipe the slate clean of existing firms. The US experience suggests a different model. Rather than wholesale disruption, the American system is characterised by renewal through re-ranking. Established firms persist, but are systematically repositioned as new leaders emerge. The core competitiveness gap lies less in the survival of firms and more in Europe’s limited capacity to demote incumbents to important but secondary positions and promote successive generations of innovation leaders.
Final Takeaways
The purpose of this Insight is not to offer yet another set of policy prescriptions for closing Europe’s innovation gap. These already exist in abundance, from ECIPE and elsewhere. It is now overwhelmingly clear that Europe’s R&D shortfall is rooted less in isolated policy failures and more in the broader mechanisms that govern firm growth, competition, and capital allocation.
This piece instead aims to refocus attention on the core structural issues, ensuring that they are not lost in simplified public debates once longer reports fade from view. Taken together, the five charts point to five central takeaways for EU policymakers:
- Europe’s innovation gap is structural, not cyclical.
The problem did not begin in the early 2010s, but it has become most visible since then. Policy responses over the past 15 years have done little to reverse the trend – and may, in some cases, have reinforced it.
- The R&D deficit is concentrated in high-tech sectors.
Europe’s gap is primarily a digital and deep-tech problem. Protecting legacy industries and subsidising incumbents cannot substitute for sustained innovation investment from high-growth, technology-intensive sectors.
- Incumbents are not the enemy.
Simplistic narratives of European paralysis versus American dynamism are misleading. Established firms can remain valuable contributors to innovation – provided they are allowed, and encouraged, to play supporting rather than dominant roles.
- Leadership turnover matters more than firm turnover.
Europe’s core weakness is not that incumbents survive, but that they rarely relinquish leadership. New firms struggle to scale into top R&D positions, leaving the corporate innovation hierarchy largely unchanged.
- The real gap lies in scaling new innovative firms.
The US advantage lies less in creating new companies than in enabling them to rise to the top of the innovation system. Europe lacks comparable institutional, financial, and competitive mechanisms to support systematic scale-up and leadership turnover.
Together, these findings suggest that Europe’s innovation challenge is neither about wiping the slate clean nor about preserving the status quo. It is about building a system that consistently allows capital, talent, and influence to be reallocated towards the most dynamic young firms – generation after generation.